custom colors in heatmap with ComplexHeatmap and colorRamp2 in R
When creating heatmaps with the ComplexHeatmap package in R, controlling the color scheme is crucial for visualizing the data effectively. The colorRamp2 function from the circlize package is a powerful tool that allows you to map numeric values to colors, providing flexibility in color gradients.
First, ensure you have the necessary libraries:
library(ComplexHeatmap)
library(circlize)
Let’s create a sample matrix for demonstration:
mat <- matrix(rnorm(80, 2), 8, 10)
mat <- rbind(mat, matrix(rnorm(40, -2), 4, 10))
rownames(mat) <- letters[1:12]
colnames(mat) <- letters[1:10]
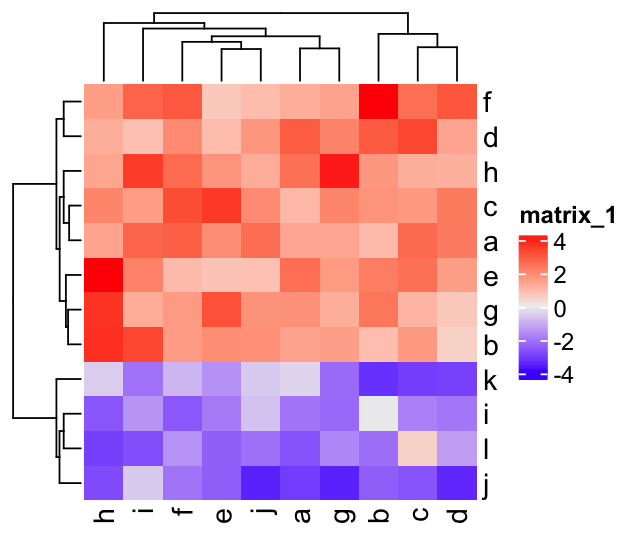
Here’s a basic heatmap with the default color scheme:
Heatmap(mat)
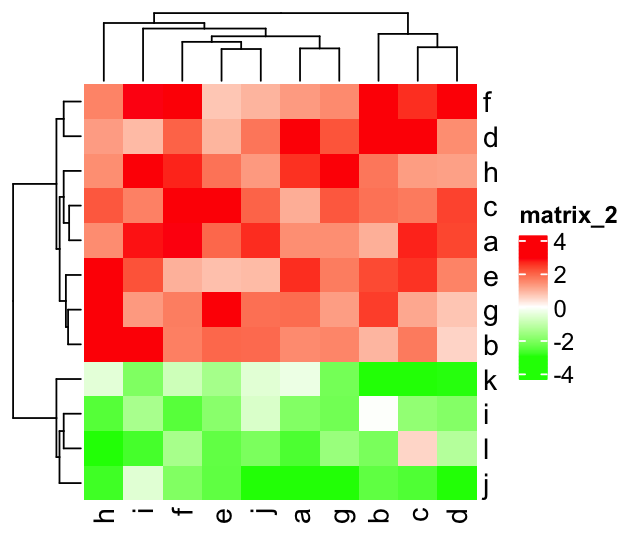
Customizing colors with colorRamp2
To customize the colors, you can use the colorRamp2 function to map specific values to colors. For example, to map -3 to green, 0 to white, and 3 to red:
customColors <- colorRamp2(c(-3, 0, 3), c("green", "white", "red"))
Heatmap(mat, col = customColors)
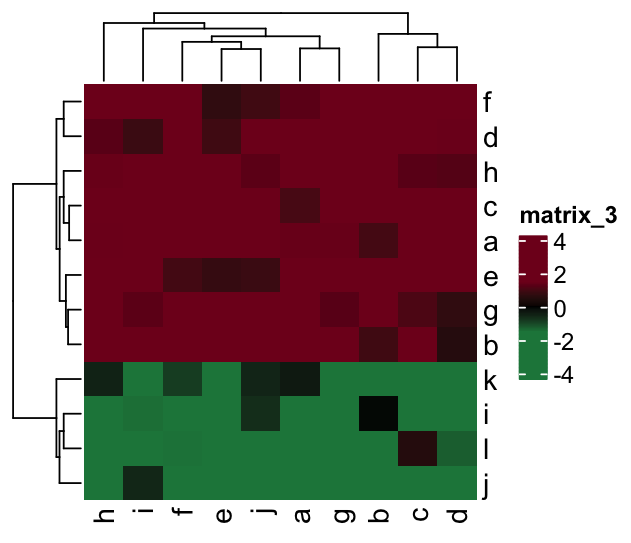
Example with more breakpoints
For more nuanced control, you can specify additional breakpoints and corresponding colors. Here, we map -4 and -1.5 to shades of green, 0 to black, and 1.5 and 4 to shades of burgundy:
FC_colors <- colorRamp2(c(-4, -1.5, 0, 1.5, 4), c("#1E8449", "#1E8449", "black", "#800020", "#800020"))
Heatmap(mat, col = FC_colors)