customizing heatmap with complexHeatmap
In this post, we will explore two features to customize heatmaps:
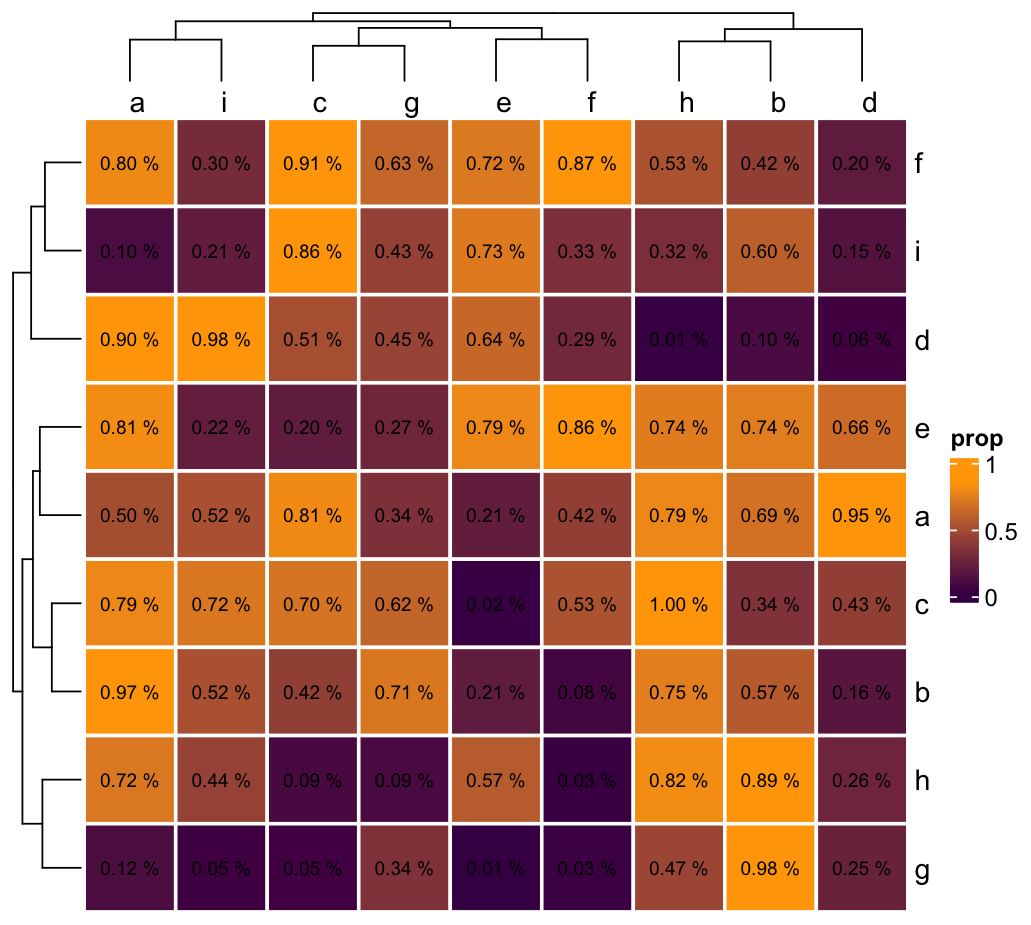
- customize the border of the heatmap cell
- display text inside each cell
rect_gp
The rect_gp parameter customizes the borders of the heatmap cells, setting the color to white and the line width to 2.
rect_gp = gpar(col = "white", lwd = 2),
cell fun
The cell_fun parameter allows for custom text inside each cell, displaying the value as a percentage with two decimal places.
cell_fun = function(j, i, x, y, width, height, fill) {
          grid.text(sprintf("%.2f %%", data_matrix[i, j]), x, y, gp = gpar(fontsize = 8, col = "black"))
        }
Code to generate this heatmap:
# Load the libraries
library(ComplexHeatmap)
library(circlize)

# Set the seed for reproducibility
set.seed(11111)

# Define the size of the dataset
n_rows <- 9
n_cols <- 13

# Generate a dataset with random values between 0 and 100
data_matrix <- matrix(runif(n_rows * n_cols, min = 0, max = 1), nrow = n_rows, ncol = n_cols)
colnames(data_matrix) <- letters[1:n_cols]
rownames(data_matrix) <- letters[1:n_rows]

# Set the color scale with
customColor <- colorRamp2(c(0, 0.85, 1), c("#440154FF", "#FFA500", "#FFA500"))

Heatmap(data_matrix, name = "prop",
        col = customColor,
        rect_gp = gpar(col = "white", lwd = 2),
        column_names_side = "top", column_names_rot = 0,
        cell_fun = function(j, i, x, y, width, height, fill) {
          grid.text(sprintf("%.2f %%", data_matrix[i, j]), x, y, gp = gpar(fontsize = 8, col = "black"))
        })