pretty summary table of a dataframe with gt_plt_summary from gtExtra R package
The gtExtras R package helps create beautiful data tables. One useful function is gt_plt_summary, which generates a summary plot for a dataFrame.
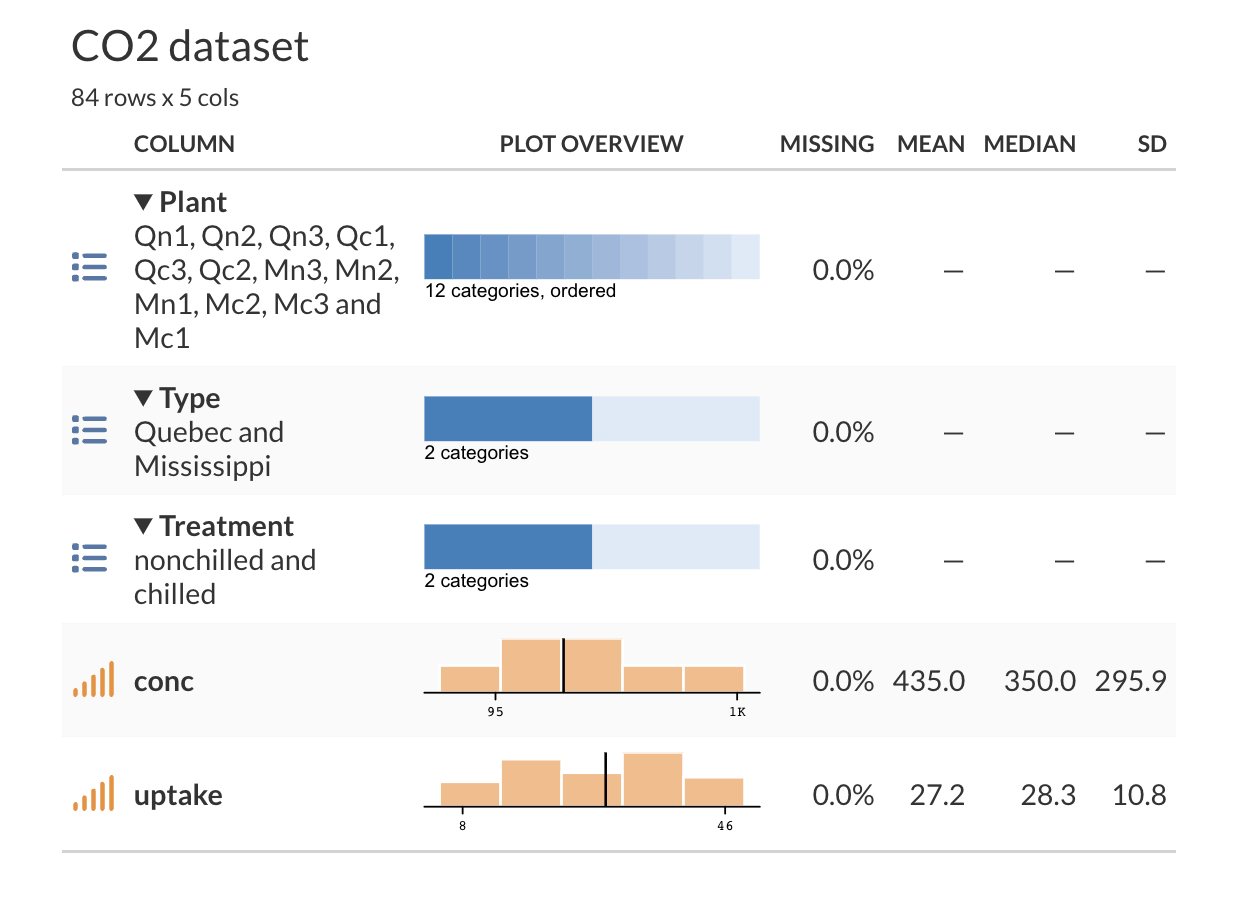
Example with CO2
library(tidyverse)
library(gtExtras)

CO2 %>% gt_plt_summary(title = "CO2 dataset")
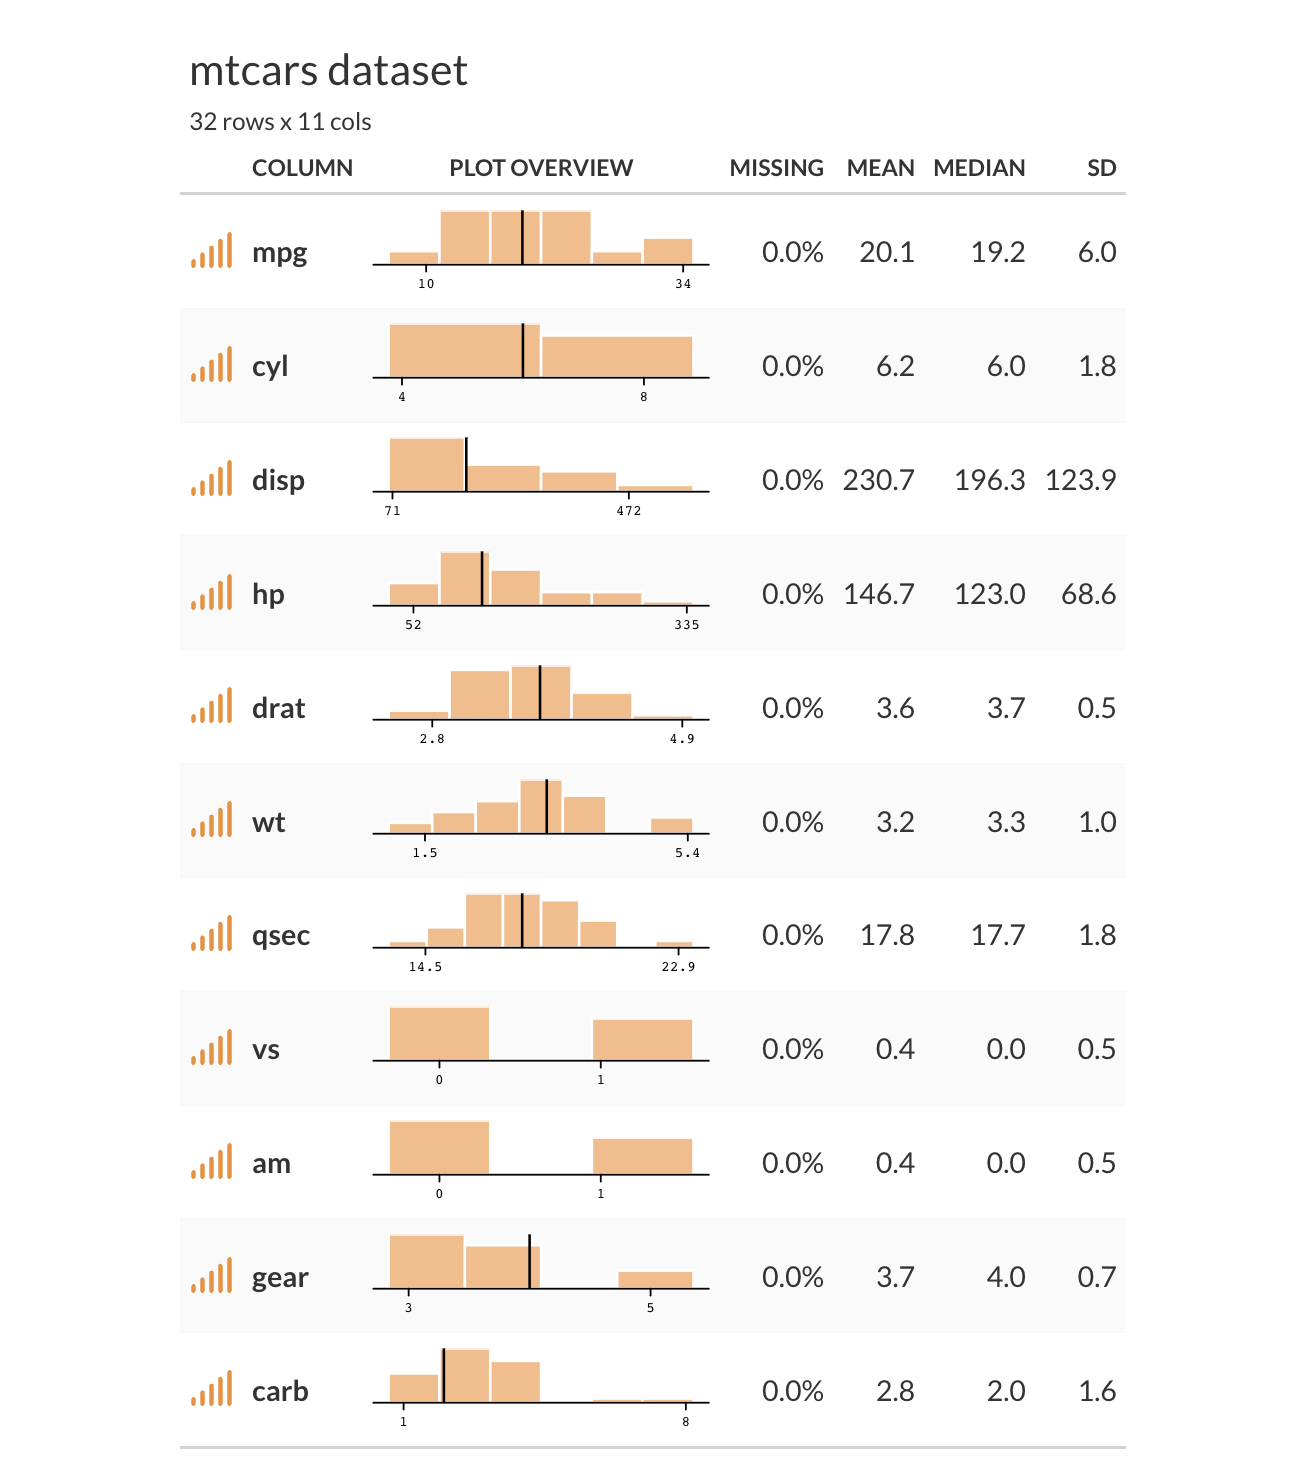
Example with mtcars
library(tidyverse)
library(gtExtras)

mtcars %>% gt_plt_summary(title = "mtcars dataset")