stunning boxplots with ggplot2
Creating visually appealing boxplots in R can be easily achieved using the ggplot2 package. Here, we demonstrate how to use ggplot2 along with viridisLite and hrbrthemes to enhance the appearance of boxplots. We’ll use the penguins dataset from the palmerpenguins package for this demonstration.
library(tidyverse)
library(ggplot2)
library(viridisLite)
library(palmerpenguins)
library(hrbrthemes)
Boxplot with notches
penguins %>%
  ggplot(aes(x = species, y = bill_length_mm, col = species, fill = species)) +
  geom_boxplot(outlier.size = 0.1, notch = TRUE, notchwidth = 0.8, width = 0.5) +
  theme_ipsum() +
  scale_fill_manual(values = viridis(n = 4)) +
  scale_colour_manual(values = viridis(n = 4)) +
  stat_summary(
    fun = median,          # Specify the function to calculate the median
    geom = "crossbar",
    aes(group = species),     # Group data by the 'species' to calculate medians separately
    color = "white",       # Choose the color for the median line
    size = 0.25,            # Set the thickness of the median line.
    width = 1          # Set the width of the median line
  )

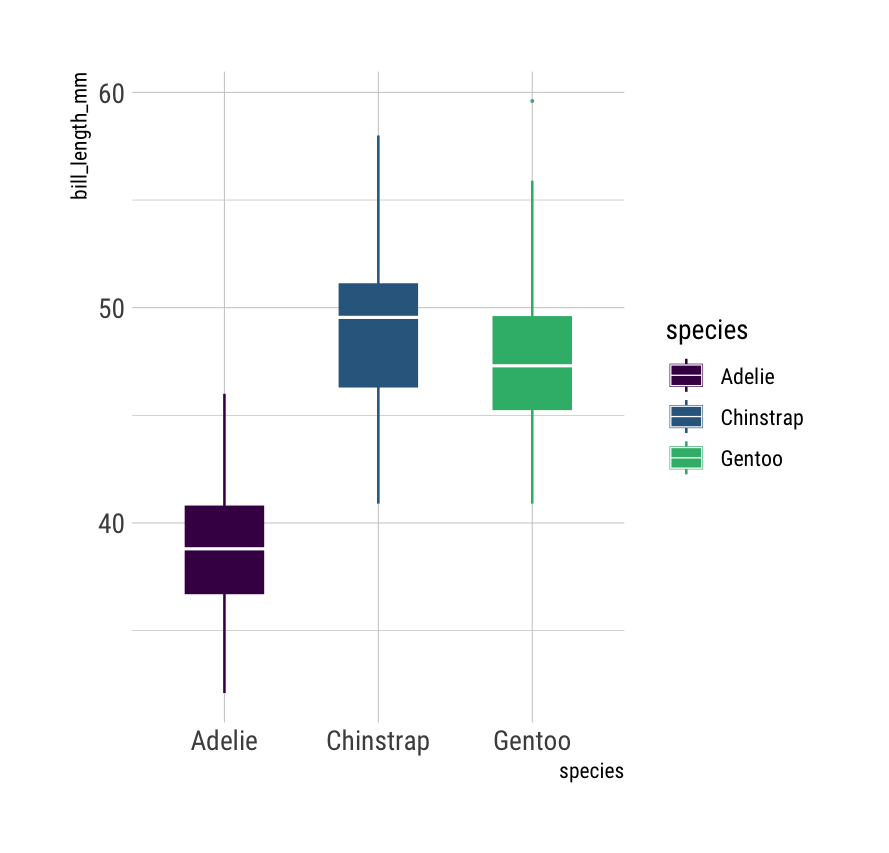
Boxplot without notches
penguins %>%
  ggplot(aes(x = species, y = bill_length_mm, col = species, fill = species)) +
  geom_boxplot(outlier.size = 0.1, notch = FALSE, width = 0.5) +
  theme_ipsum_rc() +
  scale_fill_manual(values = viridis(n = 4)) +
  scale_colour_manual(values = viridis(n = 4)) +
  stat_summary(
    fun = median,          # Specify the function to calculate the median
    geom = "crossbar",
    aes(group = species),     # Group data by the 'species' to calculate medians separately
    color = "white",       # Choose the color for the median line
    size = 0.25,            # Set the thickness of the median line.
    width = 1          # Set the width of the median line
  )